.jpg?width=110&height=79&name=Hi-Res%20Logo%20%20(320%20%C3%97%20230%20px).jpg "Hi-Res Logo (320 × 230 px)")
.jpg?width=145&height=104&name=Hi-Res%20Logo%20%20(320%20%C3%97%20230%20px).jpg "Hi-Res Logo (320 × 230 px)")
New NWEA research analyzing MAP Growth data from roughly 2,000 U.S. school districts found that 1 in 4 students now misses at least one day every other week on average, and 1 in 3 in high-poverty districts. The study, released in July 2026, draws a direct line from chronic absenteeism to stalled academic recovery. For charter directors and special programs coordinators building intervention layers this year, the finding reframes the entire question of how Tier 2 and Tier 3 tutoring should be measured. Attendance is not a side conversation. It is the precondition for any dosage-based intervention to work, and the new data suggests most schools are still operating on assumptions that no longer hold.
What the NWEA Study Actually Found
The NWEA research brief, Chronic absenteeism: A continued impediment to academic recovery, tracked MAP Growth scores in grades 3-8 across a national sample of 2,000 districts from 2019 through 2024. NWEA defined "high chronic absenteeism" as a district where 20% or more of students missed 10% or more of school days, and looked at which districts sustained those rates across 2022, 2023, and 2024.
The academic consequence shows up at the district level. Districts with consistently high absenteeism sat roughly 50% further from math recovery than districts that never experienced high absenteeism. In high-poverty districts, those with lower absenteeism recovered more strongly than peers with higher absenteeism. Reading gaps followed the same pattern but were smaller. The NWEA authors were direct: attendance and academic improvement should be understood as pieces of the same puzzle, not separate issues.
Separately, Attendance Works reports that nearly five years after the onset of the pandemic, more than 20% of students are still chronically absent, and that data from 31 states for the 2024-25 school year show overall rates have improved nationwide but remain higher than before the pandemic. Nat Malkus at AEI has tracked similar figures using district-level data across 44 states and DC. Rising from about 15 percent before the pandemic, chronic absenteeism rates exceeded 28 percent by 2022 and declined by nearly 3 percentage points in 2023, just over 2 points in 2024, and just under 1 point in 2025, with the AEI Return to Learn Tracker showing that improvement is slowing dangerously. This is not a return-to-normal curve. It is a plateau.
Why This Hits Charter and Independent-Study Schools Harder
If you sit inside a charter LEA or an independent-study program, the national numbers understate your operational reality. Independent-study and homeschool-charter models have historically shown higher absenteeism variance than site-based schools, because "attendance" is measured through work-samples submissions and learning-record cadence rather than seat time. A student who misses two weeks of tutor contact in an independent-study program may still be counted as attending, because their assignment log is current.
That measurement gap matters when you build a Tier 3 caseload. A student flagged for intensive intervention based on MAP scores alone may look like an intervention candidate, but if their engagement pattern shows a 40% missed-session rate, they are functionally an attendance case first and a tutoring case second. In our experience working with independent-study charter partners, the schools with the strongest Tier 3 outcomes are the ones that reconcile these two data streams, MAP performance and session-attendance rate, before assigning dosage.
What The Research Says About Dosage
The evidence base on high-impact tutoring is well established. The National Student Support Accelerator at Stanford has documented that tutoring produces the largest effect sizes when it meets three conditions: delivered by consistent tutors, at least three times per week, in sessions of 30 minutes or longer, using materials aligned to classroom instruction.
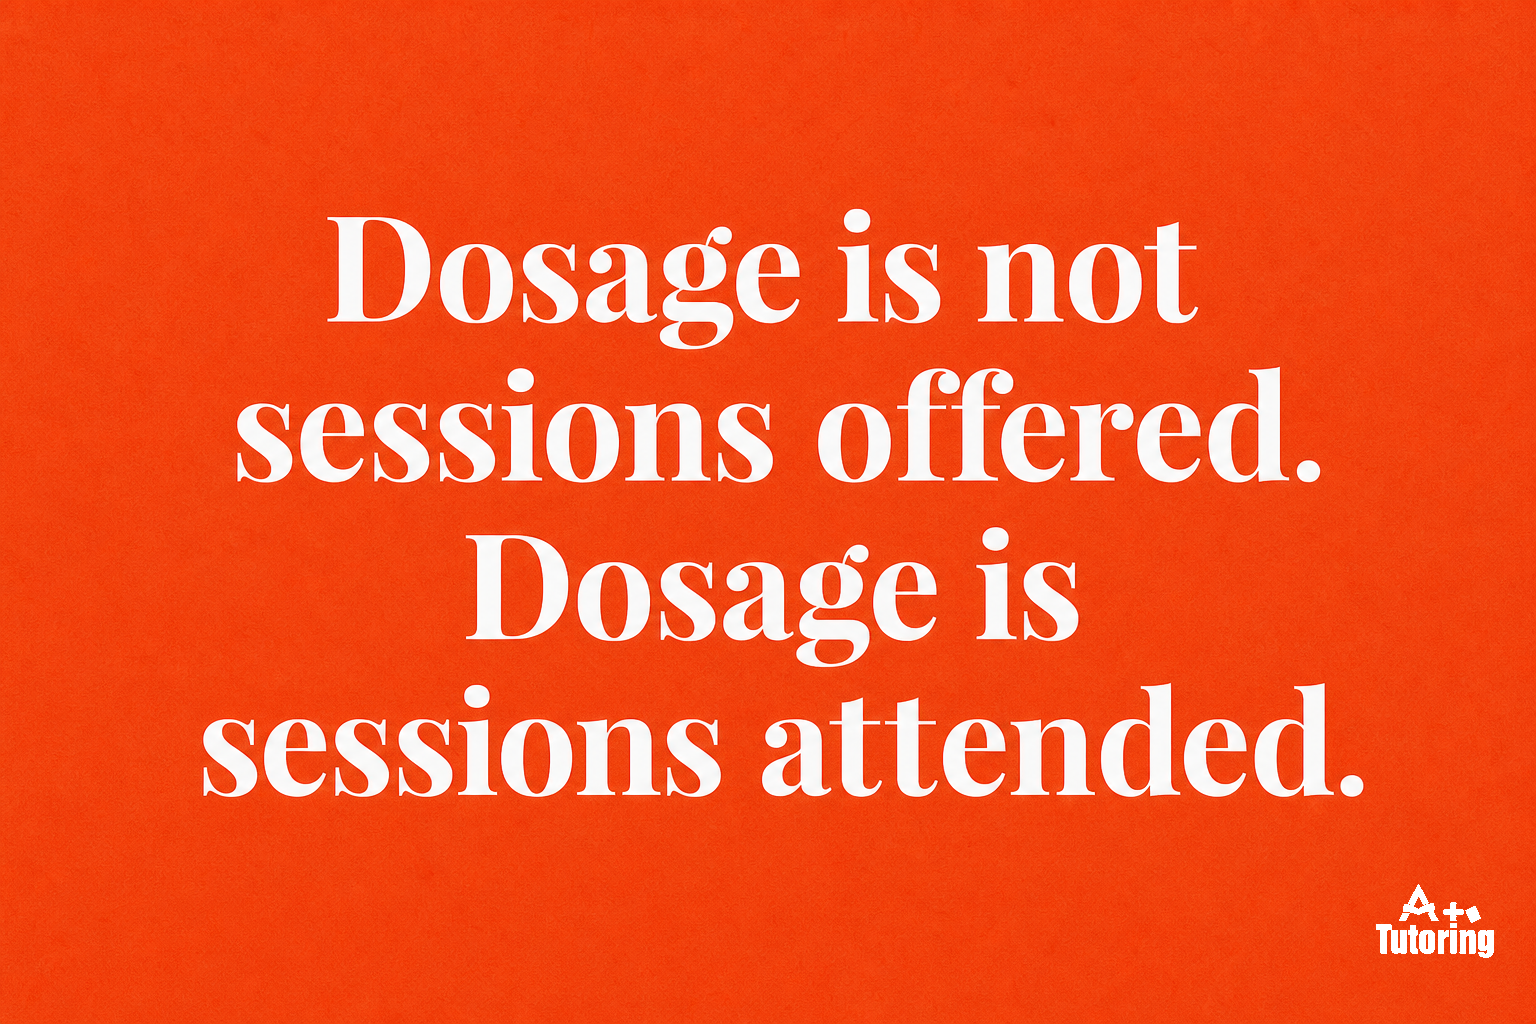
The Accelerator's evidence base points to one implication that A+ operates from directly: dosage is not "sessions offered." Dosage is "sessions attended." A program that schedules three sessions per week but delivers 1.8 attended sessions per week on average is not a three-times-per-week program. It is a below-threshold program, and the effect-size data does not carry over.
The Annenberg EdResearch for Recovery brief on tutoring reaches the same conclusion. In our reading of that literature, programs that hit attended-dosage thresholds produce meaningful gains in math and reading, while programs that fall below threshold produce results that look much closer to zero. The cliff is sharp, and the NWEA finding suggests a growing share of intervention rosters are sitting below it without their schools realizing.
When was the last time you audited your Tier 3 caseload not by MAP score, but by attended-session rate over the past 8 weeks?
What's Working: Attendance-Adjusted Intervention Design
The intervention providers producing the strongest results in the current attendance environment share a small set of design choices. First, they schedule Tier 3 dosage as four sessions per week, not three, on the assumption that some percentage will be missed and the goal is to preserve three attended sessions. Second, they build make-up capacity into the master schedule rather than treating missed sessions as lost. Third, they surface attendance flags to families and school MTSS teams within 48 hours of a missed session, not at the end of a grading period. Fourth, they publish attended-dosage numbers alongside outcome numbers, so that authorizers and boards can distinguish "we delivered the program" from "students received the program."
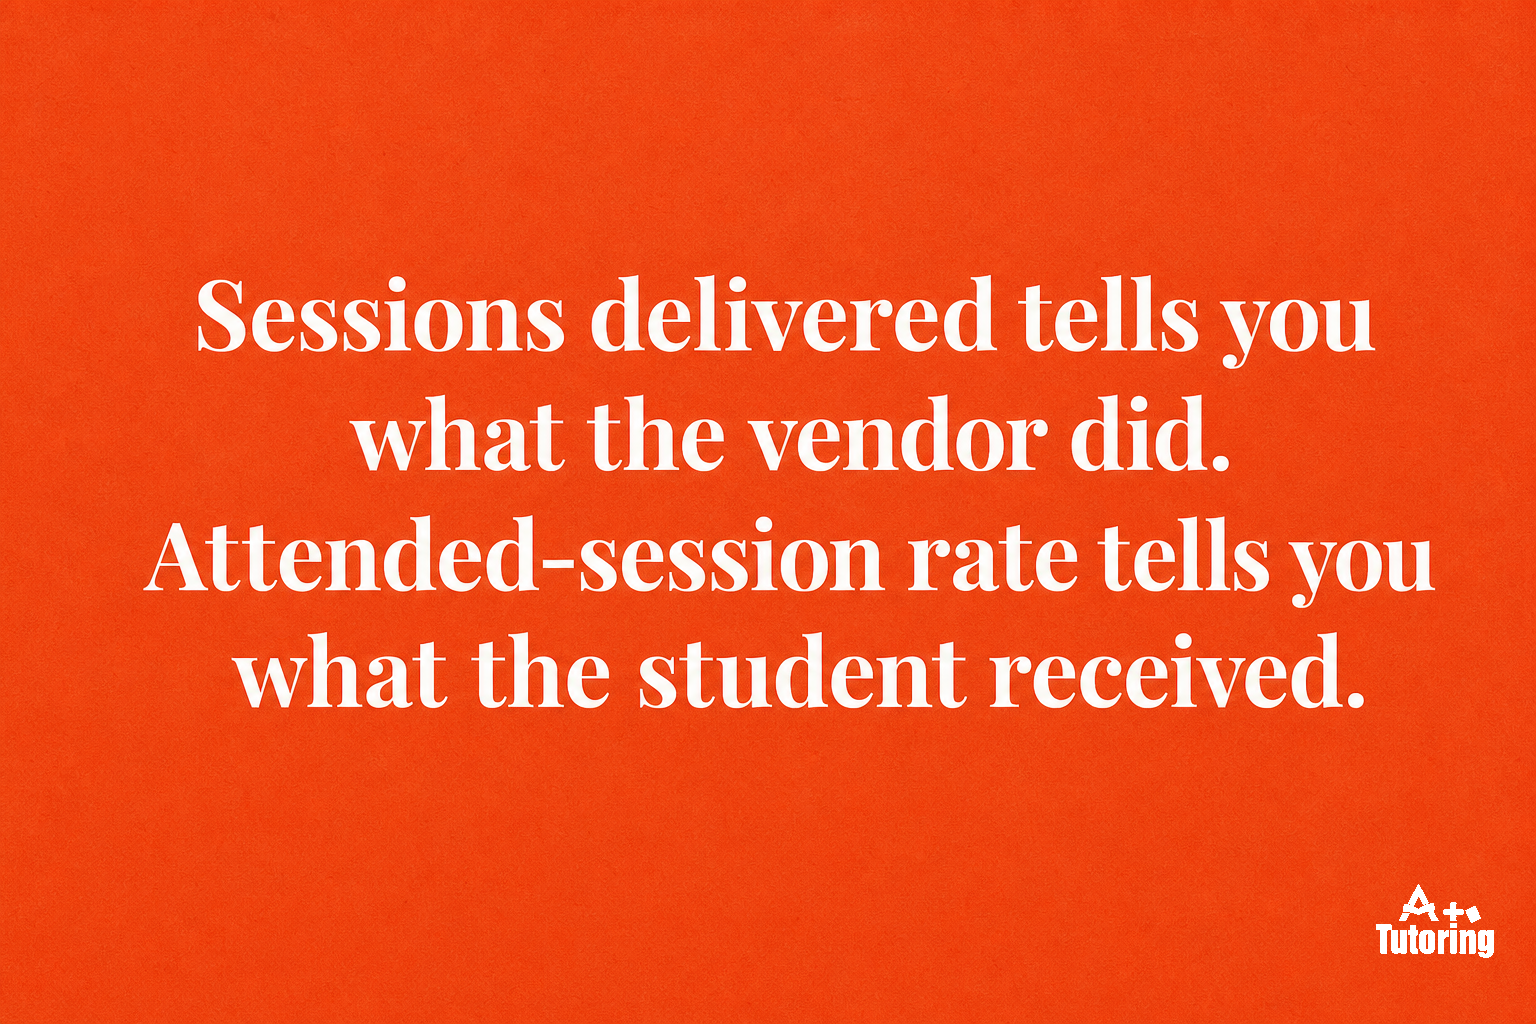
Most intervention vendors still report sessions delivered as their primary KPI. A+'s view is that this metric has quietly become misleading. Sessions delivered tells you what the vendor did. Attended-session rate tells you what the student received. Those are different numbers, and in the current attendance environment they can diverge by 20 to 40 percentage points on the same roster.
What A+ Sees in the Field
Across our partner schools this year, the Tier 3 cohorts that hit their MAP Growth benchmarks share the attendance-first design pattern above. In our iLead Exploration Math Tier 3 case study, 9 of 12 students (75%) reached growth benchmarks at 3-6x national MAP Growth norms. Our iLead ELA Tier 3 results showed 7 of 8 students (87.5%) reaching benchmark. The combined Tier 3 cohort landed at 80% (16 of 20 students).
Those outcomes were not produced by delivering more sessions. They were produced by protecting attended dosage. The A+ instructional model schedules make-up sessions within the same week a session is missed, flags a second missed session to the family and the school's special programs coordinator within 48 hours, and reconciles session-attendance data with MAP growth quarterly rather than annually. Students who are chronically absent from tutoring get escalated to the school's MTSS team as an attendance case before they get re-rostered as an intervention case.
What School Leaders Can Do Next
Five actions worth taking in the next 30 days:
-
Pull an attended-dosage report for your current Tier 3 roster. Not sessions scheduled. Not sessions offered. Attended sessions per student per week, averaged over the past 8 weeks. Sort by lowest attended rate.
-
Reconcile your MAP data against your attendance data by subgroup. The CDE dashboard will show you chronic absenteeism by student group. Cross-reference that against your Tier 3 caseload composition.
-
Audit your intervention contracts for attendance-adjusted reporting. If your vendor reports only sessions delivered, ask for attended-dosage rates and outcome data segmented by attended-dosage tier.
-
Build make-up capacity into your master schedule before the next semester. Retroactive make-ups after a student has missed a month rarely recover the lost growth curve.
-
If you sit on the federal programs side of the budget: pull your school's chronic absenteeism rate by Title I subgroup and cross-reference against your ESSA CSI or ATSI status. Absenteeism is often the underlying driver of the indicator that triggered the identification, and Title I / Title III dollars can fund attendance-recovery components inside a tutoring contract as an allowable use when tied to evidence-based intervention.
About A+ Tutoring
A+ Tutoring is a California K-12 virtual intervention provider working with charter LEAs, independent-study programs, and district partners to deliver Tier 2 and Tier 3 instruction aligned to MAP Growth and state standards. Our partner schools have shown 75% of Math Tier 3 students, 87.5% of ELA Tier 3 students, and 80% of the combined Tier 3 cohort reaching growth benchmarks at 3-6x national MAP Growth norms, using an attendance-first dosage model.